

4.7 out of 12k+ reviews

Get approved today for a medical cannabis card in Ohio, 100% online.
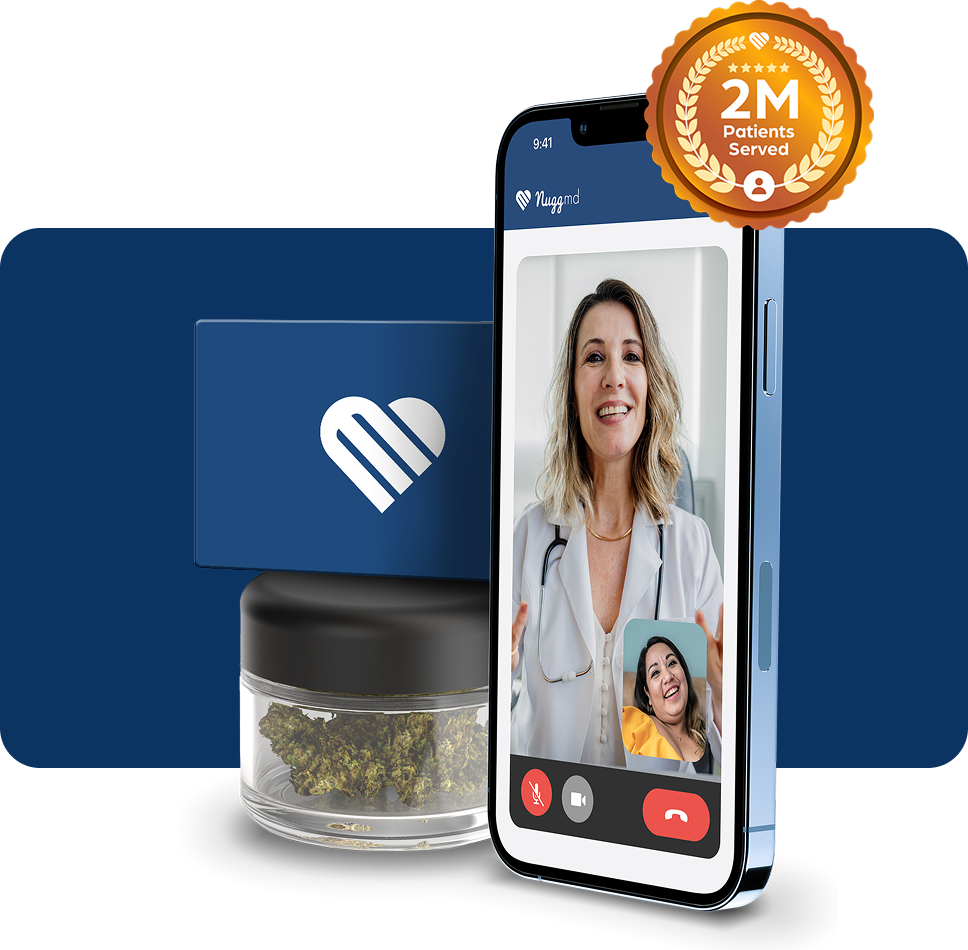
Quick & easy access from the nation’s #1 trusted med card provider.
Mike from CA
Approved for Chronic Pain
As seen on

"Very easy to work with and reminds you it's time to renew. So kind and patient. Would recommend!"
Julie A.
10 months ago
"Great service Doctor was quick same day appointment Renewed my certification quickly"
Derek B.
1 year ago
"Simple and fast service. The appt happened within minutes of the request. Easy to talk to staff."
Daniel M.
1 year ago
"Amazing company, really helpful and I got my medical card in less than 24 hours!"
Frank C.
11 months ago
"These folks have been an absolute pleasure to work with - very professional and accessible."
Ronald B.
1 year ago
3 simple steps to get approved in Ohio today.

Tell us about yourself.
Securely sign up with no appointment needed. If you have a question, your NuggMD Support team is available via chat, daily from 8am-10pm.

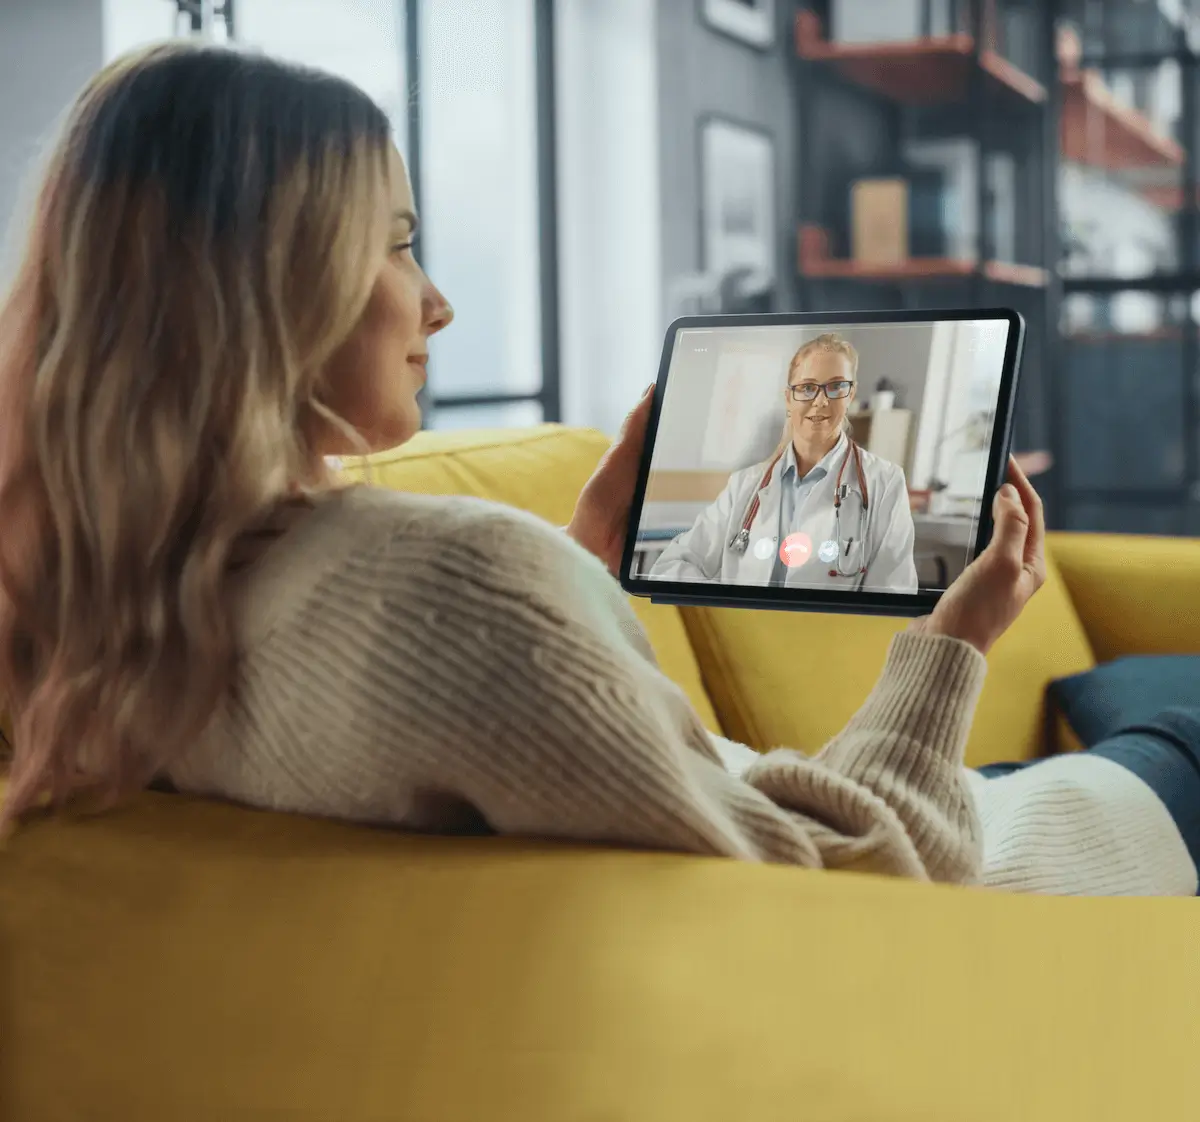
Meet with a licensed cannabis doctor.
Chat via phone or video with a professional clinician near you, all from the comfort of home. Most approvals take 15 mins or less.

Get approved today, online.
Your consultation for medical marijuana in Ohio is risk free. If you are not approved for any reason, you’ll get your money back. It’s that simple.
Approved or your money back - guaranteed.
Get 10% off for a limited time!
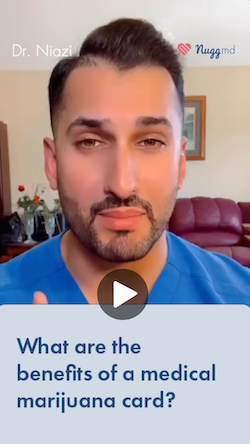
Get answers from one of our top doctors.
Making the right decision for your health starts with being informed. Get the answers you’re looking for from Dr. Niazi, or chat with our live support team if you want more answers.
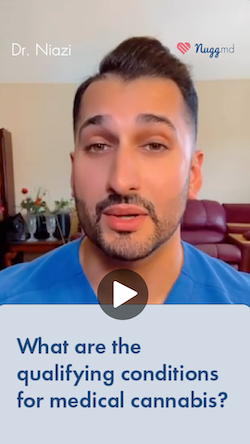
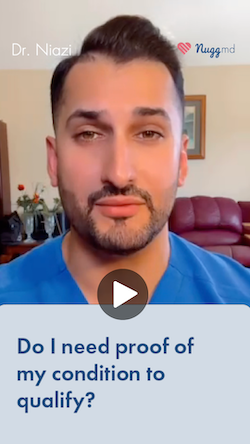
What are Ohio’s qualifying conditions?
Each state has its own set of “qualifying conditions” for medical cannabis, and some don’t require medical proof that you have it. Take our free quiz to find out if you’re likely to qualify.
- AIDS
- Amyotrophic lateral sclerosis (ALS)
- Alzheimer’s disease
- Cachexia
- Cancer
- Chronic traumatic encephalopathy
- Crohn’s disease
- Epilepsy or another seizure disorder
- Fibromyalgia
- Glaucoma
- Hepatitis C
- Huntington’s disease
- Inflammatory bowel disease
- Multiple sclerosis
- Pain that is either chronic and severe or intractable
- Parkinson’s disease
- Positive status for HIV
- Post-traumatic stress disorder (PTSD)
- Sickle cell anemia
- Spasticity
- Spinal cord disease or injury
- Terminal illness
- Tourette syndrome
- Traumatic brain injury
- Ulcerative colitis
Conditions that aren’t listed, like anxiety, arthritis, chronic migraines, and complex regional pain syndrome, may be covered under a separate condition, such as PTSD or severe pain.
Meet your Ohio med card perks.
Your Ohio med card unlocks access to medical cannabis products, legal protections, deals near you, and guidance when filing in your state.


Access to lab-tested products
Purchasing legal medical cannabis from an Ohio MMCP dispensary ensures you’re using safe, tested product.

Increased legal & job protections
Ohio medical cannabis patients receive legal protections that aren’t available to consumers without a med card.

Savings on cannabis & other taxes
Adult-use sales have begun in Ohio, but registered patients are exempt from the 10% recreational cannabis tax.

Guidance from licensed professionals
Get support from an Ohio-licensed practitioner who can answer your healthcare and cannabis questions.

State application filing guidance
We help you file your required approval with the state as the final step to getting access to medical cannabis.
What to expect after you’re approved.
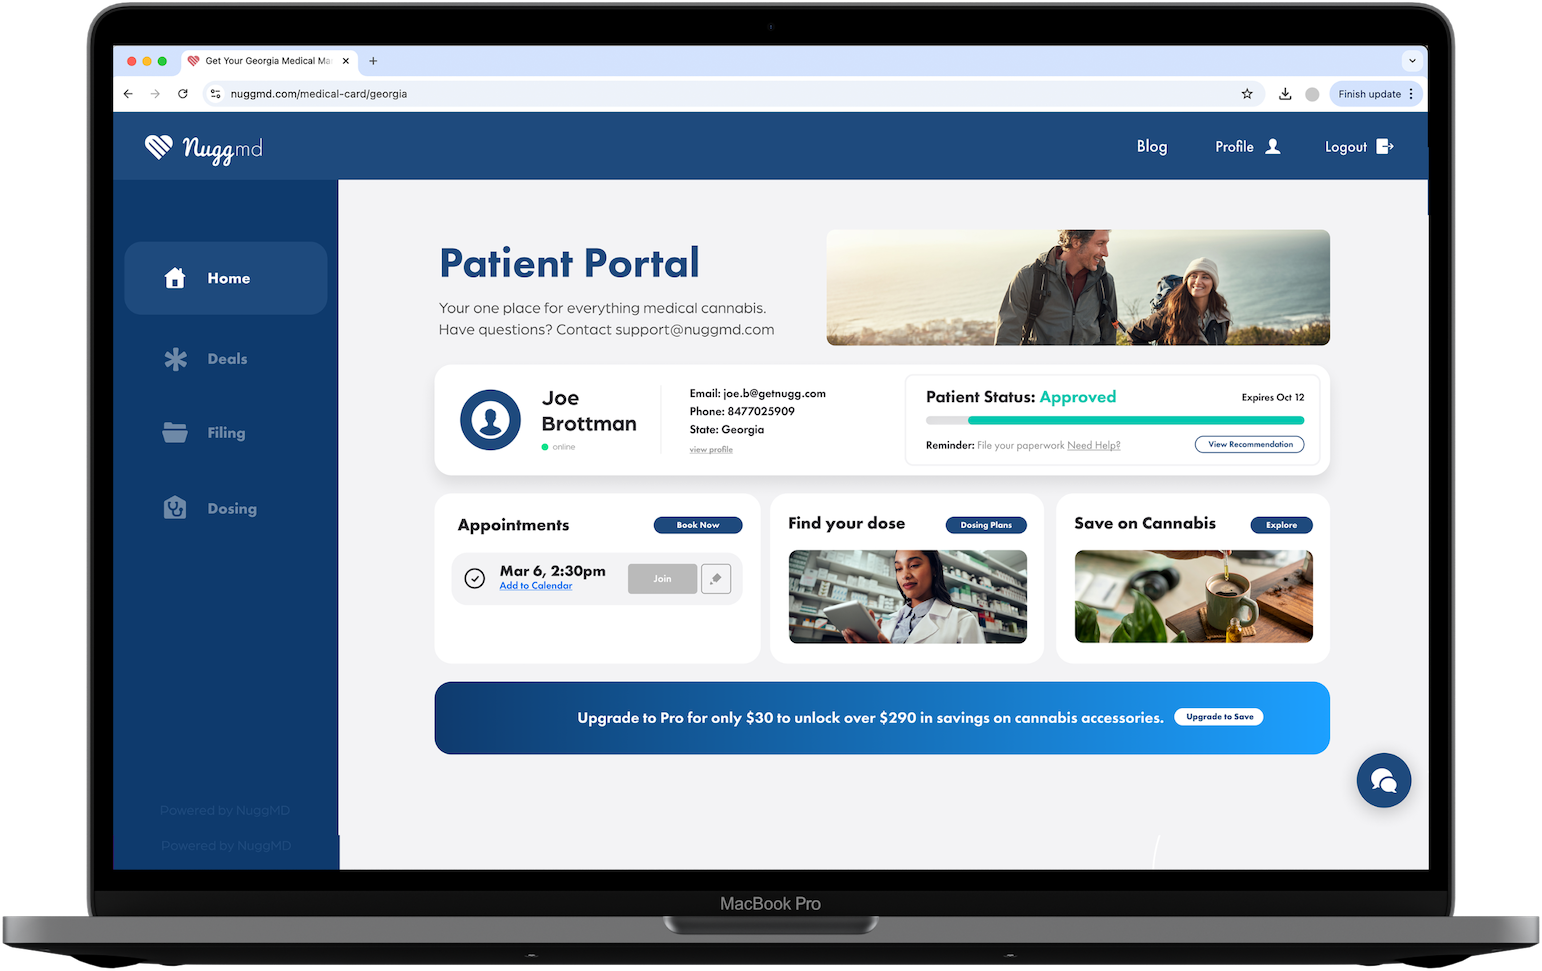
You’ll have full access to our patient portal, where you can view your rec, get state filing support, explore dosing plans, and more. At NuggMD, you’re getting more than a med card.
Why we’re the #1 provider in the nation.
Other Providers |
Offices |
||
|---|---|---|---|
Same day physician access |

|

|
|
Approved or your money back |
|
|
|
No appointment needed |
|
||
50+ in network docs |
|
||
100% online |
|
||
7-day live support |
|
||
State filing guidance |
|
We’re on a mission to help you find relief through cannabis.
At NuggMD, our mission is to free people from their ailments with a personalized path to cannabis relief. We’re proud to be the leading medical card provider, and are continuing to pioneer new, patient-focused paths to relief.
Frequently asked. Frequently answered.
To qualify for a medical marijuana card in Ohio, you must:
- be at least 18 years of age (minors must have a caregiver who is at least 21).
- have a qualifying condition
- be certified by a physician who is registered to recommend medical marijuana
- be an Ohio resident with proof of residency
Ohio allows med cards for conditions like chronic or severe pain, PTSD, cancer, epilepsy, and more. Check the state’s full list of qualifying conditions to see if you may qualify.
Most patients in Ohio qualify under existing conditions, but there is a process to add conditions that aren’t listed. The process is slow and takes roughly a year. To add a qualifying condition in Ohio, the patient must submit a petition to the Ohio State Medical Board. You can learn more about the process on the Ohio State Medical Board’s website.
Be honest about your symptoms and how they affect your life. Common concerns include chronic pain, migraines, PTSD, or trouble sleeping. Your doctor will evaluate whether medical cannabis may help. No script needed!
Your physician must authorize the use of a caregiver in Ohio and link the caregiver to you in the state’s database if you need one. Your doctor is the only person who can complete this step. A patient can link up to two caregivers to their account, and no caregiver can serve more than two patients.
Once the physician enters the caregiver into the database, they will receive an email to complete the registration process. Caregivers must be approved by the State Board of Pharmacy, which can take up to seven business days.
Medical cardholders in Ohio enjoy benefits that aren’t available to recreational consumers, including:
- saving money on taxes,
- enjoying added legal protections,
- and receiving proper medical guidance from qualified doctors.
Only patients with a valid Ohio med card can buy cannabis from medical dispensaries. Recreational cannabis is now available in Ohio, but may not offer the same accessibility, product selection, or savings available with a med card.
Ohio no longer charges a registration fee for a medical marijuana card. Patients are still responsible for the cost of their medical cannabis evaluation, which can be completed with no risk through NuggMD because you’re only billed if you’re approved for medical cannabis.
With NuggMD, if you’re not approved get your money back, automatically. We believe everyone deserves access to a qualified medical cannabis doctor, and the cost of an evaluation shouldn’t be a barrier.
If you’re not approved for your medical marijuana certification, your evaluation is free.
If you sign up and pay for your evaluation, but then cancel before your evaluation, there is a small $10 fee for the payment processing.
Once you’ve been approved and issued your certification, a refund for services will no longer be available. Please send an email to support@nuggmd.com with the subject line “Refund Request” and a brief description of your issue.
We want to make sure you’re 100% satisfied with your purchase being that you, the customer, are the most important thing to us! Once a refund has been initiated, please allow 3-5 business days for the funds to transfer back to the card you used for the transaction. If any issues arise, please feel free to reach back out for further assistance.
Ohio medical marijuana patients can purchase and possess up to a 90-day supply of cannabis at one time. However, only half of the prescription can be filled every 45 days. The specific limits for different cannabis products are:
- Cannabis Plant Material: Up to 9 ounces (10 ounces for terminal patients)
- Cannabis Topicals: Up to 26.55 grams of THC (29.5 grams for terminal patients)
- Edibles & Tinctures: Up to 9.9 grams of THC (11 grams for terminal patients)
- Vaporization Oils: Up to 53.1 grams of THC (59 grams for terminal patients)
Patients with a terminal illness are allowed higher limits.
Recreational consumers can purchase cannabis at recreational dispensaries. Medical marijuana patients in Ohio can purchase cannabis from any Ohio MMCP dispensary location.
Patients and recreational users can purchase oils, tinctures, capsules, plant material, edibles, lotions, creams, and transdermal patches.
Adults can now cultivate up to six cannabis plants at home. Households with up 2 or more adults can cultivate up to 12 plants.
Since marijuana is still federally illegal, insurers will not reimburse for the cost of medical marijuana products.
Federal law prohibits cannabis users from owning firearms, even though medical use is legal in Ohio. A medical card may impact your ability to purchase or possess a gun under federal guidelines.
Yes. While having a medical card offers legal protections that may not be available to recreational consumers, Ohio employers are not required to accommodate cannabis use. Depending on your workplace policies, you may still be subject to drug testing or termination.
You can see a qualified practitioner for your Ohio medical evaluation in as little as 15 minutes. Once approved, your physician will upload your approval to the state’s database within 24 to 48 hours, and you’ll receive an email with instructions for how to complete your registration with the state. Once the state approves your registration, you’ll be able to print out your card and use it at a dispensary right away.
Yes! You can see any physician with an active Certificate to Recommend cannabis from Ohio’s State Medical Board. All NuggMD physicians are licensed in the state for which they provide medical marijuana evaluations and have received all state-required certifications and training.
Traveling across state lines with cannabis is illegal under federal law, even if you have an Ohio medical marijuana card. However, some states do recognize out-of-state medical marijuana cards through reciprocity agreements. Before traveling, it’s important to check the medical marijuana laws in your destination state to see if they accept out-of-state cards.
Yes, you can as of June 2021. Before this, patients were required to present a valid Ohio driver’s license or passport. Now, the Ohio Board of Pharmacy allows a driver’s license or ID from any other state or any of the following documents:
- Birth certificate,
- Consular report of birth abroad,
- Certificate of naturalization,
- Certificate of citizenship,
- Permanent resident card,
- I-797 Case Type of N-565
If you choose to use ID from another state, or one of the documents listed above, you’ll also need to provide two proofs of residency such as a W-2, paystubs, bill, deed, rental or mortgage statement. The list is extensive.